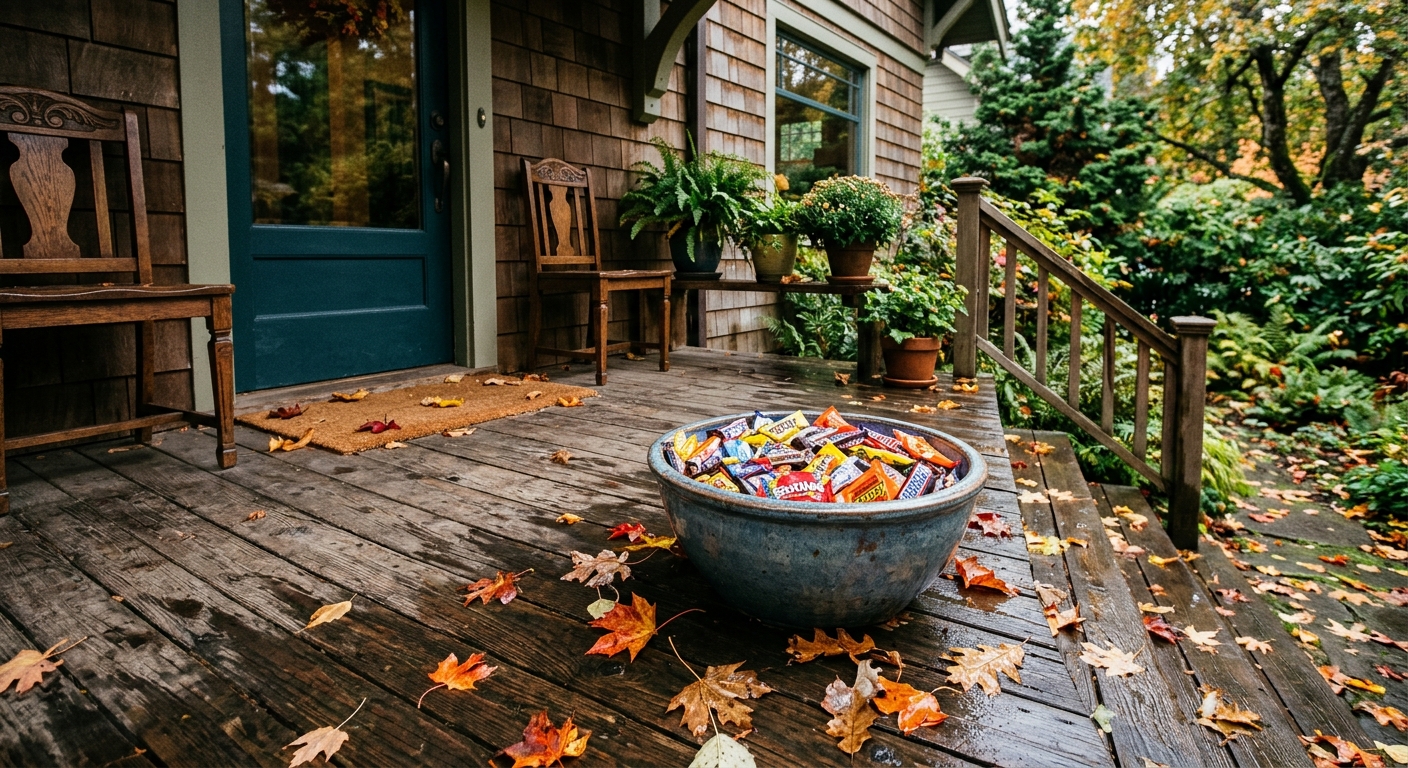
AI-generated illustration; not a photograph of the reported event.
- calendar_today October 31, 2026
Annual Treat Count Shines Spotlight on B.C. Neighbourhoods
This Halloween, CBC British Columbia and Simon Fraser University's City Program are once again collaborating to gather data for the annual halloween treat count, tracking how many trick-or-treaters visit neighbourhoods and the types of treats handed out. The collected information will be displayed on an interactive map, highlighting the province's most active Halloween areas.
Interactive Map Lets Residents Track Trick-or-Treat Hotspots
On October 31, residents across B.C. can participate by reporting the number of costumed visitors they receive, along with details on the treats distributed. Results will appear on a color-coded map designed to showcase which bc neighbourhoods hand out the most treats and attract the largest crowds of trick-or-treaters. The map is scheduled to begin updating at 9 p.m. PT on Halloween night, allowing communities to immediately see where the action is happening.
Longstanding Traditions and Neighbourhood Participation
Halloween remains a vibrant tradition in British Columbia, with certain neighbourhoods standing out year after year. According to Andy Yan, director of Simon Fraser University's City Program, areas like Vancouver's Douglas Park and New Westminster's Queens Park have consistently topped the annual treat count for more than a decade and a half. Yan notes that these neighbourhoods display strong levels of civic engagement, often paralleled by high voter turnout and deep community connections among residents.
Community Generosity Endures Despite Economic Challenges
Yan observes that, even in the face of rising inflation and broader economic uncertainties such as ongoing trade disputes, the generosity of British Columbians toward their neighbours during Halloween has remained steady. The willingness to share treats and foster festive spirit has not diminished, highlighting the resilience and communal ties within B.C.'s neighbourhoods.
Exploring the Link Between Civic Engagement and Halloween Participation
This year’s Halloween treat count comes on the heels of back-to-back municipal and provincial elections in British Columbia. Yan expresses curiosity about how recent voter turnout may correlate with trick-or-treating hotspots, as the treat count has become something of a barometer for community participation and civic pride over the years.
How to Participate in the 2026 Halloween Treat Count
Residents who wish to showcase their neighbourhood’s Halloween spirit are encouraged to tally the number of trick-or-treaters visiting their homes and submit their data using the provided online form. Participants can also detail the types of treats given out and share their preparations to welcome Halloween visitors.
With the survey’s results, the interactive halloween map will offer a real-time look at which neighbourhoods are most active this Halloween, revealing patterns of civic engagement and community enthusiasm across British Columbia. To see how your area compares or contribute to the results, check the CBC website for updates and instructions.
Source: cbc.ca.